


By Jackie Miller, Special to WaterWrights.net
What They Can Tell Us (and What They Can’t)
As the first full month of California’s core wet season, December is when early impressions of a water year begin to form—dry conditions invite hand-wringing, while wet conditions spark cautious optimism.
History shows those impressions are often unreliable: December can be dramatic, disappointing, or deceptively quiet, and this year managed to be all three.
December’s History
California’s statewide December precipitation record highlights just how variable the month can be (see below). December precipitation from 1895–2013 ranges from years with barely measurable totals to extreme outliers. December 1955 stands apart, with more than 10 inches of precipitation statewide, an upper bound that few years have approached since.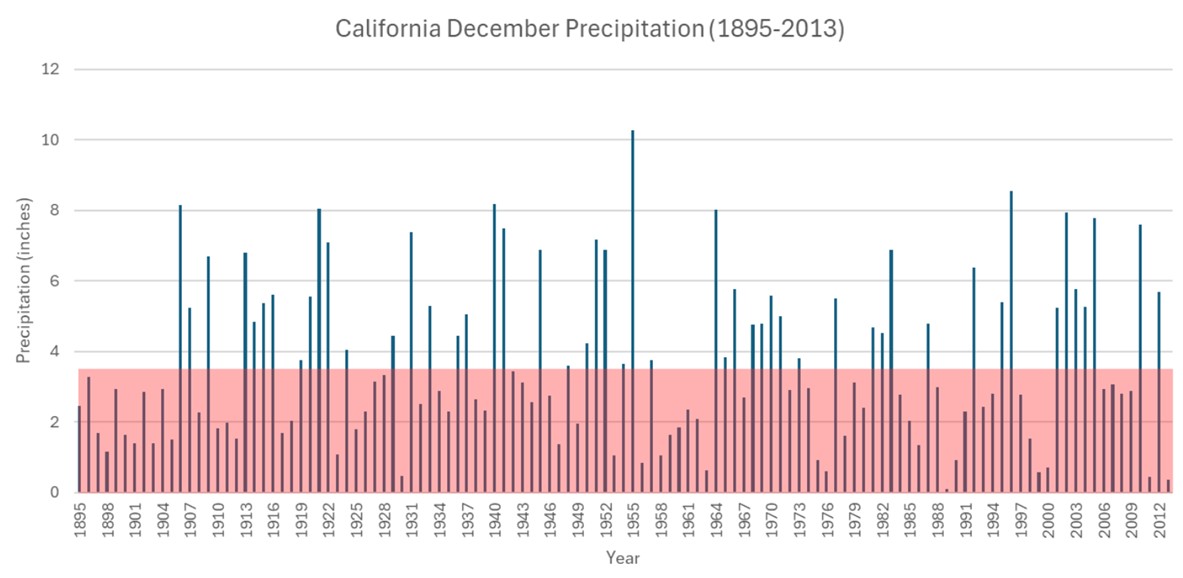
The long-term average December precipitation over this period is approximately 3.63 inches (red shading). Despite the wide year-to-year swings, the long-term trend is notably flat, increasing by only about 0.0024 inches per year. In other words, while December is volatile, its average contribution to the water year has remained remarkably stable over more than a century.
A Quiet Start, A Not-So-Quiet End
This water year began with meaningful precipitation in November, putting early totals ahead of schedule. Enter optimism. However, that changed in December, when accumulations through mid-month were flat, reinforcing a familiar lesson: early-season momentum does not always persist.
That pattern shifted abruptly in the final weeks of December.
Late-month storm systems delivered widespread precipitation across California’s major hydrologic regions (see map).
Using California Water Watch regional data, the contrast between conditions before the storms (December 16) and after their passage (January 5) is striking: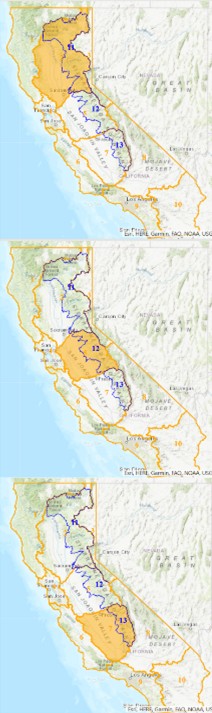
- Sacramento River Region:
7.98 inches (81% of average to date) → 21.39 inches (151% of average to date) - San Joaquin River Region:
6.98 inches (107% of average to date) → 14.64 inches (146% of average to date) - Tulare Lake Region:
5.27 inches (155% of average to date) → 11.39 inches (205% of average to date)
The accumulation traces below capture December’s inflection point—a transition from a slow, steady start to a rapid surge of precipitation late in the month. The blue shading represents the historical average and shows how quickly conditions can shift from near or below normal to well above normal within days.
Is it too early to relax our hand-wringing and give a cautious high five?
What December Can (and Can’t) Tell Us
Even with a dramatic finish, December alone remains a weak predictor of final water-year outcomes. Historical records consistently show limited correlation between December precipitation totals and end-of-season conditions. California’s wet season spans several months, and January through March often play an equally—if not more—important role in shaping the final result.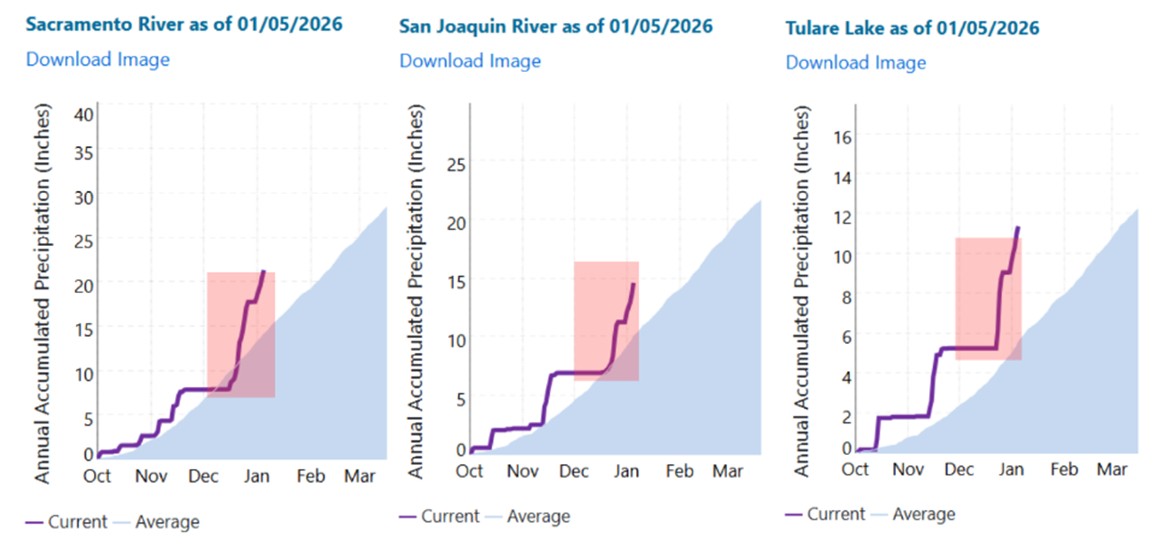
While we can’t judge the water year by December alone, we can appreciate the late-month turnaround and the progress made relative to where the month began. And how will January turn out? I guess we’ll know soon!

Jackie Miller is the Manager of Data & Product Services at Weather Tools, where she combines a curiosity about weather data with a passion for storytelling. She leads the development of monthly forecast reports, using numbers and narrative to bring clarity to customers navigating complex water year decisions. You can reach her at Jackie@weathertools.org
DISCLAIMER OF RESPONSIBILITY; Waterwrights.net strives to provide its clients with the most complete, up-to-date, and accurate information available. Nevertheless, Waterwrights.net does not serve as a guarantor of the accuracy or completeness of the information provided, and specifically disclaims any and all responsibility for information that is not accurate, up-to-date, or complete. Waterwrights.net’s clients therefore rely on the accuracy, completeness and timeliness of information from Waterwrights.net entirely at their own risk. The opinions expressed in this report are those of the author and do not represent any advertisers or third parties.
ALL RIGHTS RESERVED. Copyright 2025 by WaterWrights.net

